Dashboard and component list
Overview of all test reports and components
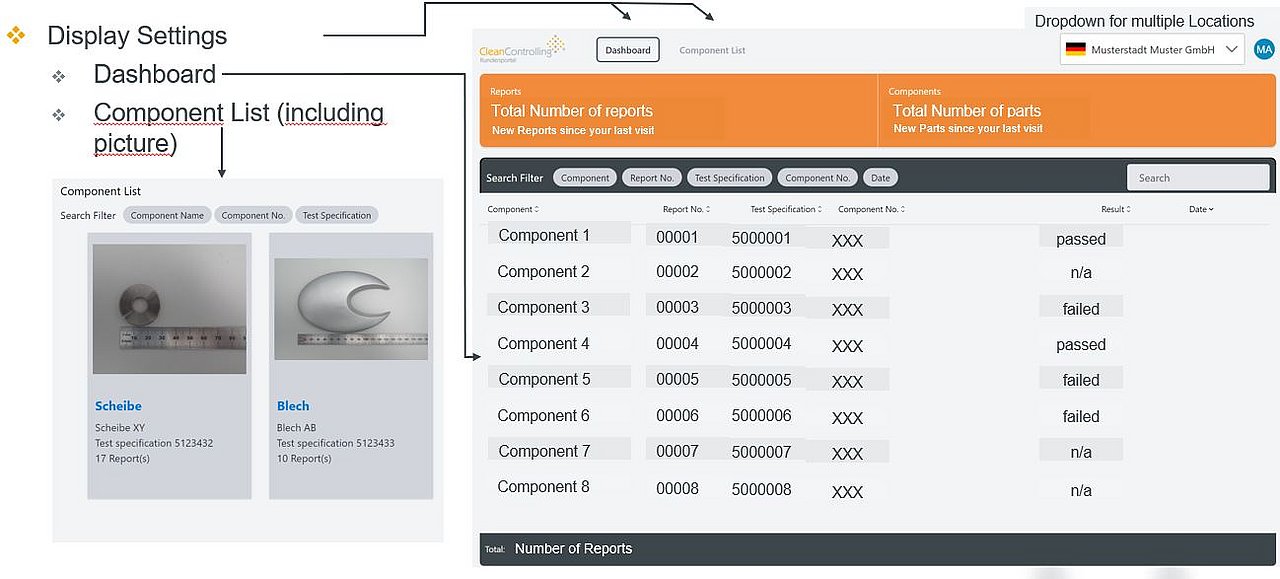
The dashboard provides an overview of all test reports of all components that have been tested by CleanControlling for your company. The clear list display shows the most recent reports first in the default setting and can be adapted very quickly and easily to personal requirements using the convenient column sorting and various search filters.
The component list gives a complete overview of the inspected components of your company and helps to identify the components quickly and clearly with the search filter, component image, component number and test specification.
Test reports and test specification
Clear and complete presentation of the information provided in the test report
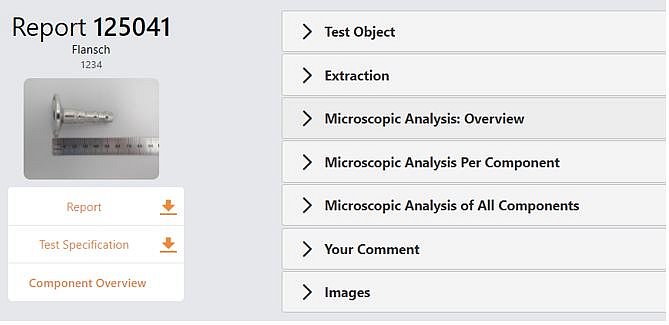
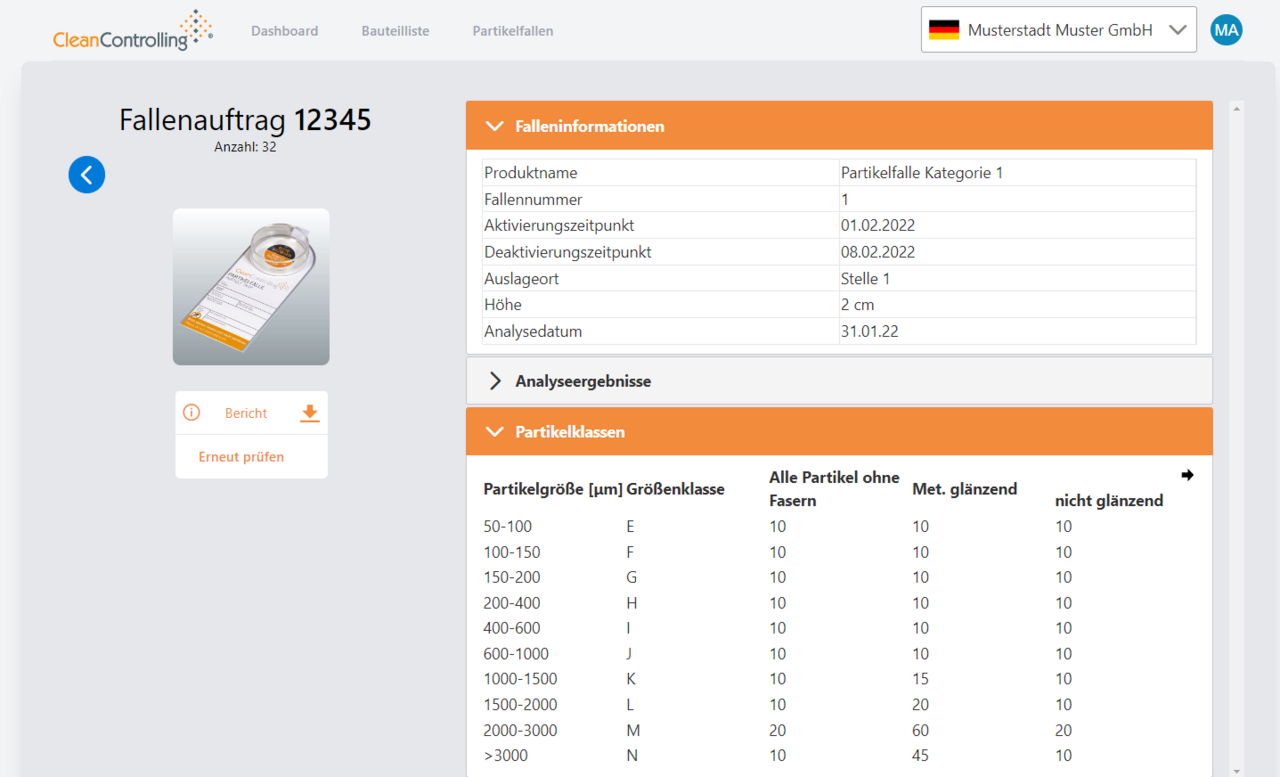
All information including particle images of the test report are presented in a clear form. Here you can find details on the test object, the extraction and the microscopic evaluation as well as the particle images of the largest particles at a glance. In the "Your comment" area, you can enter additional individual information for each test report.
You can download the formal test report and the accompanying component-specific test specification as a PDF document for your records and use it, for example, as proof for your customer.

Graphical representation of the analysis results
Interactive and graphical display - quick and easy comparison and interpretation of different cleanliness characteristics.
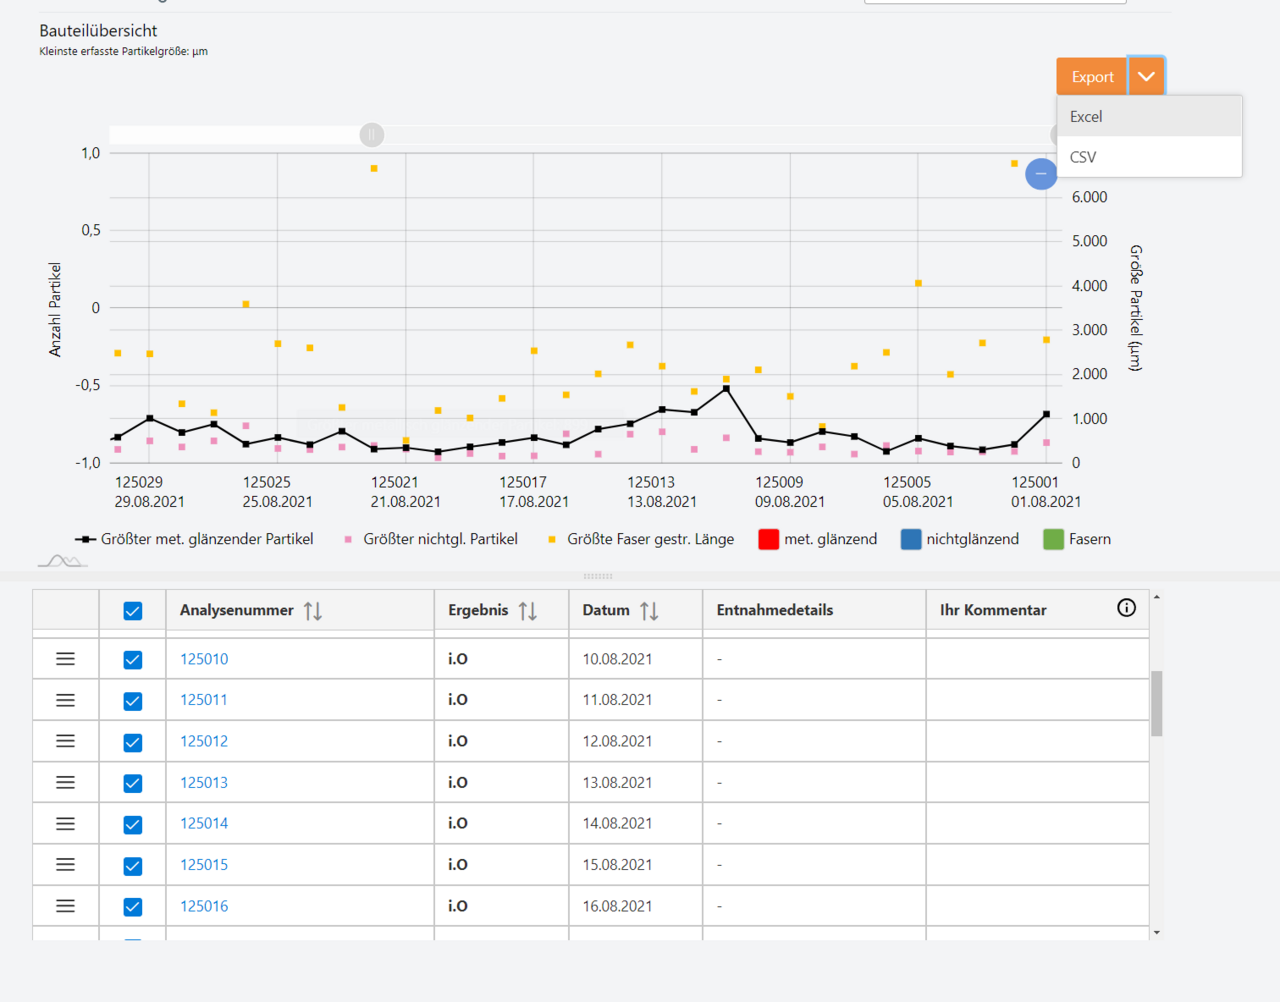
All current and previous analysis results per component are graphically displayed in the component overview and can be interactively adjusted to the relevant results and compared. This allows results to be compared easily and quickly and interpreted in a targeted manner.
This component overview helps you to monitor your processes and thus to detect changes at an early stage, e.g. caused by systematic errors.
New features:
NEW: Repeat testing - simple request process
Just a few clicks to a quote for repeat testing of your component!
The basis for monitoring the processes are regular tests or also several tests within the scope of process optimizations.
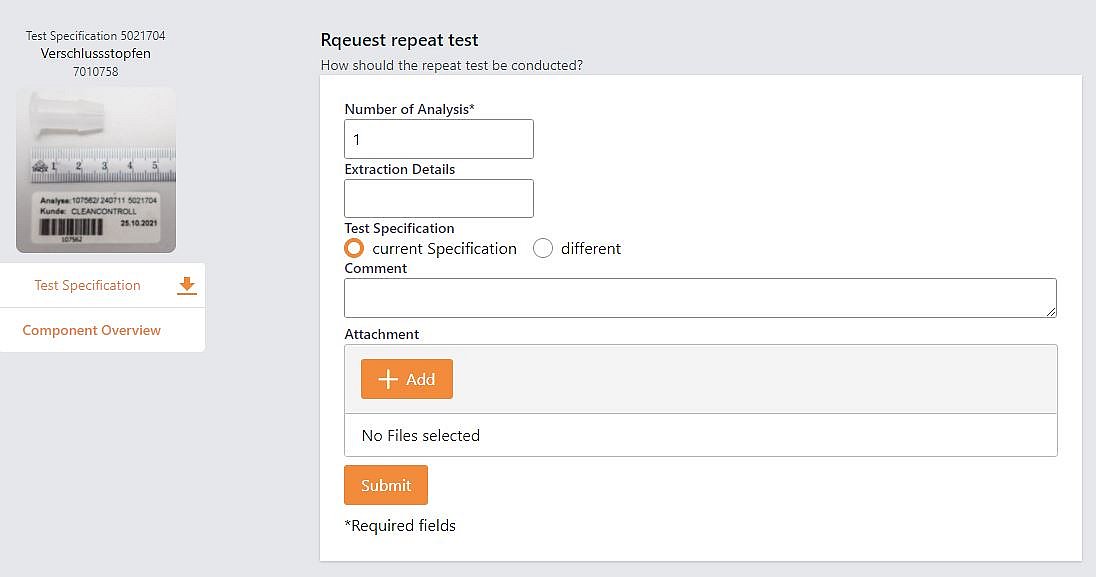
To simplify the order process for you, you can use the button "Repeat this test" to request repeat testing with just a few entries for the number of required analyses and, if necessary, additional information or changed testing requirements. You will then immediately receive our quotation for your order process and can send the components to us for testing with the attached delivery note as well as the component accompanying document.
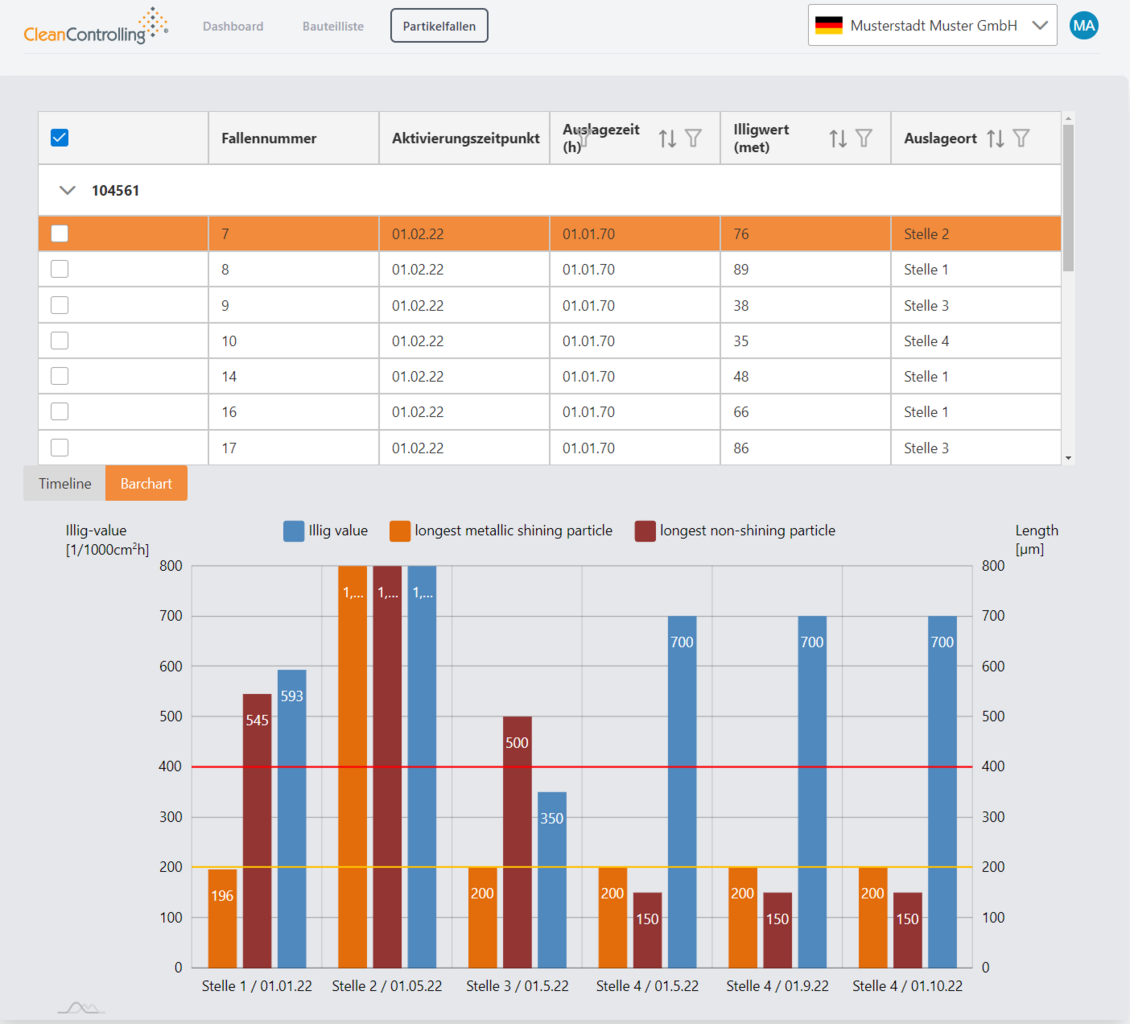

NEW: Monitoring of environmental cleanliness
Monitoring of environmental cleanliness with laying out of particle traps at particle-relevant locations in the production and assembly process is an essential element in ensuring assembly cleanliness. VDA 19.2 "Technical cleanliness in assembly - environment, logistics, personnel and assembly equipment" describes this procedure for monitoring airborne, sedimenting particles, which enables a correlation to the actual particle contamination of surfaces.
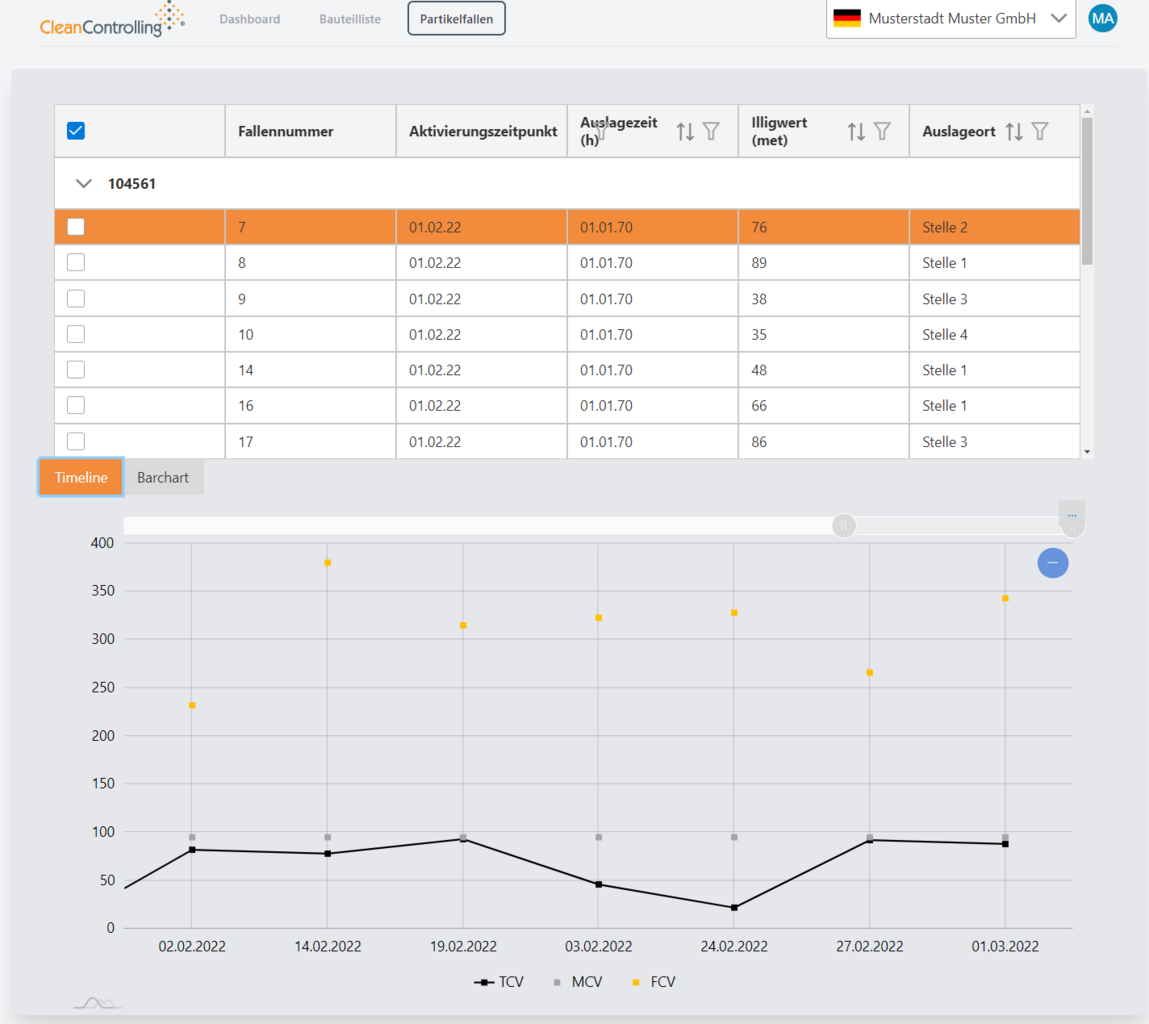
The CleanControlling Portal provides convenient support in documenting, displaying and comparing the sedimentation figures (Illig value) determined by the microscopic analysis performed by CleanControlling. The analysis result (particle size distribution) in the individual particle size classes is multiplied by a weighting factor and the weighted particle numbers are summed up. The higher weighting of the larger particles takes into account the growing damage potential. The resulting summed value is normalized to an area of 1000 cm² and related to a measurement time of 1 h. The sedimentation number has the advantage that it is not only the size of the particles but also the size of the sedimentation. This sedimentation number has the advantage that the sedimentation results become comparable due to a standardized reference value. By compressing the results to one number per measuring point, the results can be better documented and more easily compared, even across departments and plants.
The presentation and comparison of these results in interactively changeable bar graphs is conveniently supported in the CleanControlling Portal. This completely eliminates the need for time-consuming programming of individual evaluation tools.
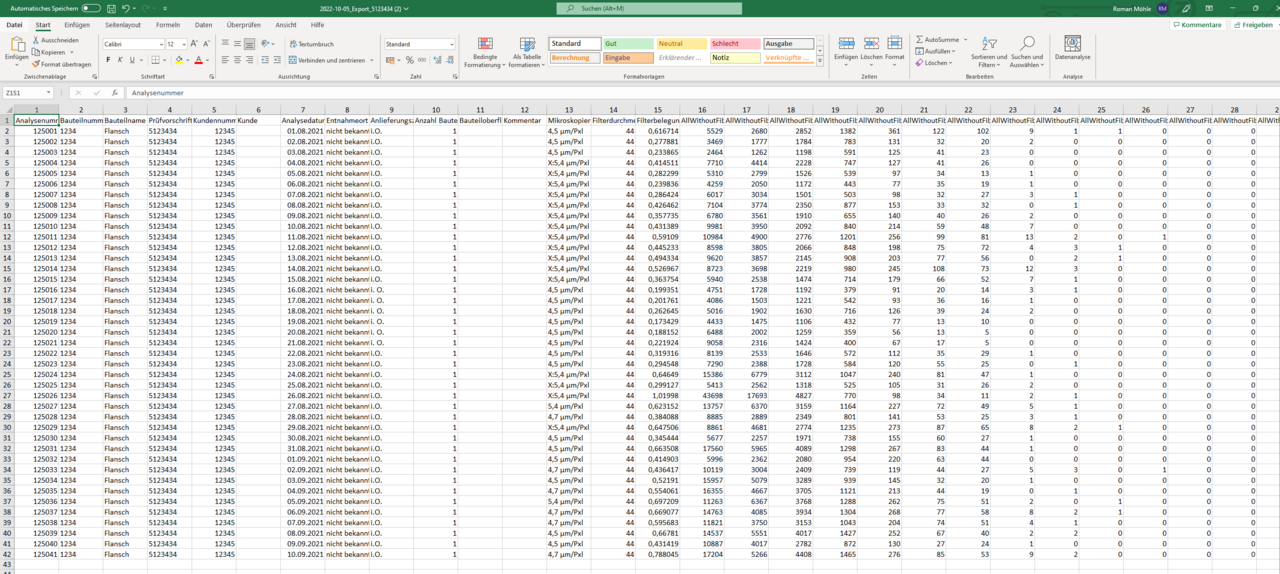
NEW: Data export for external use
If the customer already uses his own analysis tools or if the data is to be prepared individually with common tools, such as Microsoft's Power BI, the option of exporting data in EXCEL or CSV is now available. This allows the complete analysis data to be exported in the specified table format. The data mapping is then done by the customer based on the standard format of CleanControlling.
Further information
If you have any further questions, the contact persons from our sales team will be happy to help you.
Newsletter registration